Sibly curve in Iceland and Denmark
- Aristotle described what we would call natural selection.
- If there is a niche (that can provide an animal with shelter and food) and there are two animals that could occupy it, the first that gets there has an advantage so SELECTION IS A COMPETITION AGAINST TIME.
- Alfred Russel Wallace pointed out that an animal that occupies a niche and promptly undergoes speciation has the advantage of being able to occupy its legacy niche as well as the new one so SPECIATION IS A COMPETITION AGAINST TIME.
- We shall assume it takes 2,000 generations to speciation; take any number you like – the logic is the same.
- Gregor Mendel showed that living things had things that carried inheritance, two of each kind in each individual. (We shall ignore sex chromosomes.) They were passed on, one from each parent, to each offspring. We call these things chromosomes or parts of chromosomes.
- Speciation occurs when chromosomes (or critical parts) are separated by 2,000 generations.
- In a population of 1,000 there will be 2,000 homologous chromosome parts so it will take – roughly – 2,000 generations for the most closely related to get back together under conditions of random mating.
- But by that time, the speciation process has meant that they cannot have fertile offspring.
- So THERE IS INTENSE SELECTIVE PRESSURE TO HAVE A MECHANISM THAT KEEPS POPULATION SIZE AT SOME MODERATE LEVEL, NEITHER BELOW 1 NOR ABOVE 1,000.
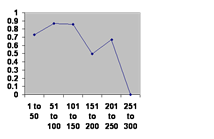
- And here it is in action:
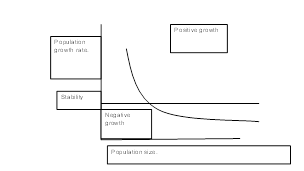
- A team led by a man named Richard Sibly wrote “On the Regulation of Populations of Mammals, Birds, Fish and Insects,” Richard M. Sibly, Daniel Barker, Michael C. Denham, Jim Hope and Mark Pagel SCIENCE vol. 309 July 22, 2005 page 609. They collected 1,700 serial field counts of wild animals and consistenly found a rest population size, below which fertility rose rapidly and above which it fell slowly.
-
A team led by Labouriau looked at Danish data and compared distance between birthplaces of a couple the number of children they had and found this:
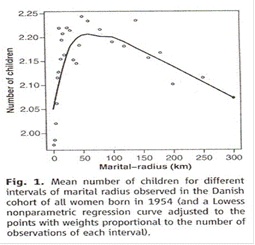
Comment on “An Association between Kinship and Fertility of Human Couples,” Rodrigo Labouriau and António Amorim, SCIENCE vol. 322 no. 5908 December 12, 2008 page 1634. For the whole story also see Human Fertility Increases with marital radius. Rodrigo Labouriau and António Amorim. GENETICS volume 178 January 2008 page 603.
- Population is proportional to area, not distance. If you correct for that, it is the Sibly curve. Moreover, they found that once you allowed for town size and distance between, there was absolutely no effect of income or education on fertility.
- It has been shown that the education of women and the average income correlate very strongly with lowered fertility. (A school for small families, Economist vol 430 no. 9128 February 2, 2019 page 50.) This is not a contradiction. Those things also broaden the social horizon.
- A team in Iceland used their genealogy to compare kinship with fertility. This is what they found for children:
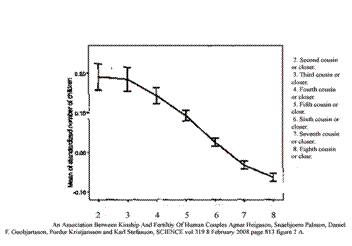
“An Association between Kinship and Fertility of Human couples,” Helgeson et al. Science vol. 319 February 8, 2004 page 813. And grandchildren: 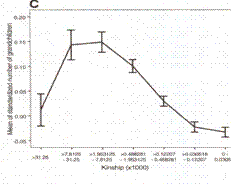 The Sibly curve is obvious and carries on for more than 1 generation. Those are 90% error bars.
- What is new here is that modern research has shown, even if few have noticed, that human fertility is determined by the kinship of a couple and their ancestors AND NOTHING ELSE.
- Welcome to cognitive dissonance. If you are not angry, you do not understand.
Mesopotamian history, China, 4 corners and mice
- If you take a specific geographic location and follow it over time, any human regime will eventually change. Lump the regimes by 50 ear intervals and graph those intervals along the bottom axis. On the vertical axis graph the chance of any regime in that interval surviving the next 50 years.
- Any process that destroys a regime from the outside, such as natural climate change, will happen unrelated to the age of the regime, and the line will be horizontal. Any process arising within the population, such as the wrong political system, should rise over time since there will be an element of selection.
Here is southern Mesopotamia: 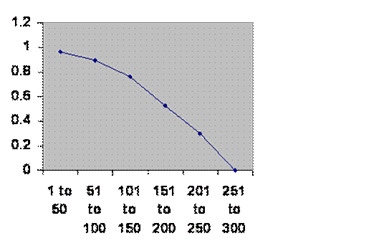 Information taken from R. H. Carling THE WORLD HISTORY CHART International Timeline. In about 1574-1596, the Ottoman Empire changed the way they recruited the Sultan’s personal guard, the janissaries. We count them as two empires changing then. The line goes up.
- The line is so clean that there can be only 1 or 2 things that can bring down a civilization, a dynasty or whatever. Since the line goes down, the cause of the fall cannot be inside or outside of the population; it can only be the fact of there being a large population. And the one thing that will destroy absolutely any regime is lack of population.
- Here is Rome lumped with Classical Mayans and Anasazi:
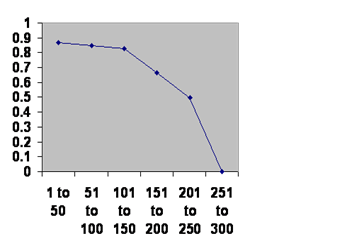 The Collapse of Complex Societies. Joseph A. Tainter. Cambridge University Press. Cambridge. Eighteenth printing, 2009, BBC and Encyclopedia Britannica. Same story.
- Egypt:
Now we see an element of selection and a few dyansties that survie past the 300 year brick wall. 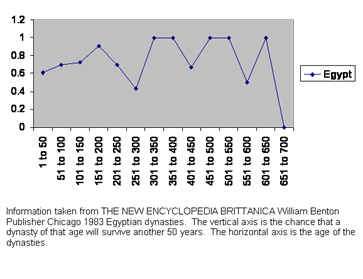
- China:
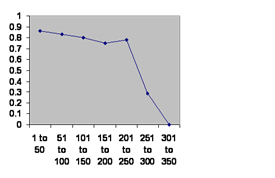 Information taken from John B. Teeple TIMELINES OF WORD HISTORY, DK Publishing, New York, NY, 2006, page 554, 555 To a first approximation all dynasties last 300 years and then die. Notice the notch.
- Japan: Here is the survival experience of Japanese dynasties.
Information taken from John B. Teeple TIMELINES OF WORD HISTORY, DK Publishing, New York, NY, 2006, page 554, 555 Japanese dynasties. The vertical axis is the chance that a dynasty of that age will survive another 50 years. The horizontal axis is the age of the dynasties. Same notch.
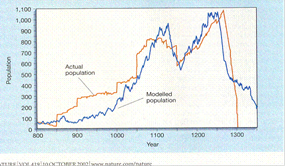
- Long house valley:
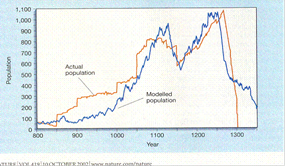 Jared M. Diamond, “Life with the Artificial Anasazi,” NATURE, vol. 419 no 6907, October 10, 2002 p 567 . Native farmers in American SW. Can you see the notch now?
Mice: 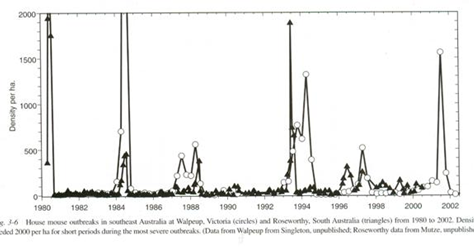 G. R. Singleton, C. J. Krebs, “The secret world of wild mice” in The Mouse in Biomedical Research, J. G. Fox, M. T. Davisson, F. W. Quimby, S. W. Barhold, C. E. Newcomer, A. L. Smith, Eds. (Elsever, Burlington, ed. 2, 2007), vol. 1, chap. 3, p. 39. Counts of wild mice in Australia. Calhoun showed that mice mate according to status and violence. Again we see the notch. Civilizations die because we employ the same mating strategy.
- What is new is A GENERAL THEORY OF HISTORY AND NATURAL HISTORY WHEREBY CIVILIZATIONS AND DYNASTIES PERISH BY CALHOUN EXTINCTION AFTER ABOUT 10 GENERATIONS AND MICE FOLLOW THE SAME PATTERN.
UN numbers, impending Calhoon extinction, Bateson birds and Swedish marriage
- The UN has accumulated data on the total fertility of countries and divided those countries into least developed, middle and most developed, thus.
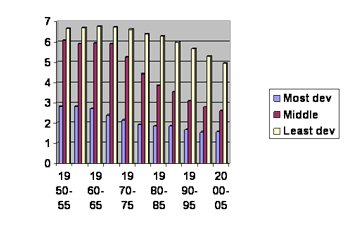
The numbers cover the fifty years into 2005 date along the bottom and children per average woman on the vertical scale .
- Resist the impulse to think that the developed countries have a low birth rate out of prudence, both personal and environmental while the least developed countries have high birth rates so the children can help with the work. Remember Tom Sawyer, who was put to whitewashing a fence by Aunt Polly. Tom almost conned a friend into doing the work. Now Aunt Polly could have got a man to do the job cheaply and been done with it. The man would have been happy with enough money to eat that day and to pay a days’ worth of rent and amortize his clothes. Tom however was a long-term commitment for Aunt Polly. He had to be fed every day, clothed and his room cost her the foregone income from renting it out. Tom also required a lot of supervision. Meanwhile his friend had nothing better to do than walk around making steamboat sounds. And feeding Tom meant not only fulfilling his caloric needs, but nurturing his growth and development. Children are not really cheap labor.
Here are the same data edited so that the first few years follow the least developed, the skip over to the middling countries and finally skipping over to the rich countries: 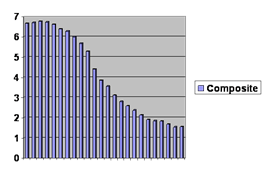
Everyone is on exactly the same curve. You can’t even tell where the edits are.
- So the children are not a prudent investment by the poor nor are their paucity prudence by the rich. There is nothing at play but kinship. Where we go one, we go all.
- Clearly the global human mating strategy is one of outbreeding. We are sliding inevitably to the right along the Sibly curve. There is already reason to think this will lead to extinction, but there are in fact more data.
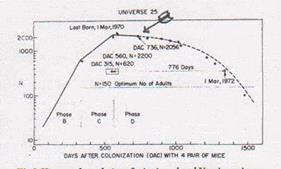
A man named Calhoun put mice in a cage, give them all the food, water, nesting material and nesting boxes they would ever need and then counted them regularly: 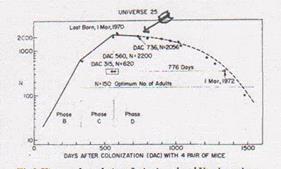
J. Calhoun, Death squared: the explosive growth and demise of a mouse population. Proceedings of the Royal Society of Medicine 66, 80-88 (1973). The population grew rapidly, births slowed and then abruptly all live births stopped. (Ignore the arrow.) The population went extinct.
A man named Hans Rosling gathered a lot of statistics and posted them on the internet. Selecting from his work, we shall look at several years of experience of Sweden, comparing total fertility with age of first marriage for women: 
Taken from gapminder.com Each circle is a year. The series of years starts at the little label. The line wanders a little and then drops decisively below replacement never to return. Fertility varies – evidently it is possible to have children earlier of later without violating the Sibly curve. But once the line starts up toward older age of marriage it never turns back, hardly even slows down. When it reaches menopause, there will be Calhoun extinction. All counties are on the same path at varying points along it.
- What is new here is that according to excellent sources, ALL OF HUMANITY HAS AN ASSIGNATION WITH EXTINCTION. Any exception is statistically invisible.
Damped oscillation in my flies and voles
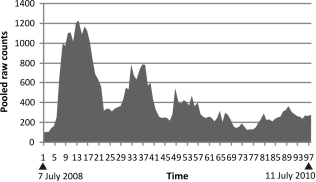
- Following along the lines of Calhoun, I put some fruit flies in a cage and counted them daily for a couple of years, fully expecting to see Calhoun extinction, even though I had not seen Calhoun’s work yet. Instead what I got was this:

Fluctuation of fertility with number in a real insect population and a virtual population M.L.Herbert & M.G.Lewis African Entomology21(1): 00–00 (2013) Instead of the iconic notch we can see damped oscillation, even though there is the opportunity for a notch. Similarly, among the Australian mice we never saw damped oscillation in spite of every opportunity.
- Calhoun showed that mating preference among caged mice keys off of status and violence. The mice established a high-status corner of their cage and a low-status corner, where there were never any mice using any of the nesting boxes. And of course, the mice fought a lot, as mice do.
- Violence is ineffective in fruit fly mating. If a male makes overtures to a female and she is not receptive, she will merely extend her ovipositor and that is the end of the story. Fruit flies mate on the basis of affection, which keys off of kinship although that is another story, and it has been shown amazingly, off of what is deemed fashionable.
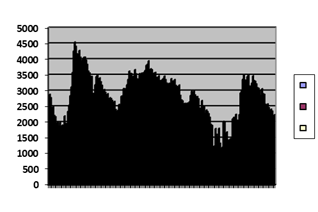
- Damped oscillation is not restricted to caged fruit flies. Here it is in European voles:
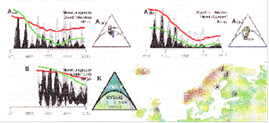 The authors drew data from a large number of vole-counting stations, much like the Australian mouse counting stations. This is a small selection of a much larger number of damped oscillation events. They did not publish and example of the two-peaked notch in spite of the voles having every opportunity to display it.
- It would seem reasonable to assume that the voles, like the fruit flies, have a mating strategy based on affection rather than violence. They can exhibit monogamous and polygamous mating strategies. Males defend territories, and females respond more to males that have marked a local territory recently. Mate preference depends largely on cohabitation. (https://en.wikipedia.org/wiki/Vole) Whether this indicates a more mouse-like or more fruit fly-like strategy is not obvious, but one can be forgiven for guessing.
- Here is a picture of a couple voles:
 https://www.google.com/search?q=voles+images&tbm=isch&source=univ&sa=X&ved=2ahUKEwigw828kargAhXoct8KHSsGCKoQ7Al6BAgAEBs&biw=1248&bih=788#imgrc=RmAYhm0GSph4eM: “Consoling moles hint at animal empathy.”
- Generally speaking, animals that show a notch shaped population trajectory tend to undergo Calhoun extinction, while those with a damped oscillation trajectory tend to survive large population sizes.
- What is new here is that MATING STATEGY CAN MAKE THE DIFFERENCE BETWEEN EXTINCTION AND SURVIVAL OF A POPULATION, WITH AFFECTION BEING SUPERIOR TO VIOLENCE.
Folic acid affecting fertility
- Since the damped oscillation is clearly based on something inherited, and since it changes too fast to be genes, the mechanism must by definition be epigenetic. The easiest epigenetic mechanism to manipulate is DNA methylation, which is increased by folic acid. So folic acid was given the fruit flies previously shown at concentrations representing dilutions of a methylating cocktail. The result was (points of change indicated):


The vertical line is pooled biweekly counts in the observation windows while the horizontal line is dilutions of the cocktail described in Diet-induced hypermethylation at agouti viable yellow is not inherited transgenerationally through the female.
Waterland RA, Travisano M, Tahiliani KG.
FASEB J. 2007 Oct;21(12):3380-5. Epub 2007 Jun 5.
- It is clear at once that the time course is neither the notch pattern we have seen nor the damped oscillation we have seen. Therefore methylation of DNA is indeed in control of the mechanism by which kinship determines fertility. To my inspection, the pattern looks like both pre-zygotic and post-zygotic components in action at the same time.
- The folic acid dose (micrograms per calorie) range in that graph overlaps what is recommended for all women who potentially might become pregnant. Inadequate folic acid (or rather folate, since folic acid does not actually exist in natural food) can cause severe neurological problems in a fetus, so one must respect that, however, given that reducing kinship can reduce fertility, one must perforce entertain the idea that very high folic acid intake might reduce fertility, not of the woman taking it but of her children.
- Accordingly, I called upon my less than excellent lab skills, established a few colonies of fruit flies and to the best of my ability kept some as controls and gave others the folic acid we all recommend.
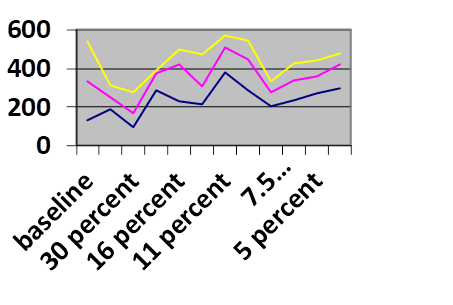
- When I counted (rather ham-fistedly) the newly eclosed (poor word, resembles enclosed, and doesn’t distinguish between larva leaving egg nor adult escaping pupa. Maybe we should just say “hatched first time and hatched second time”) flies I got this:
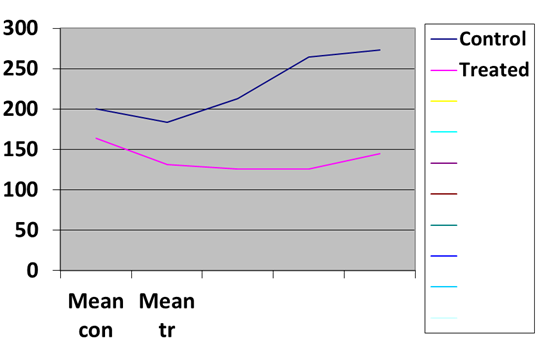 The blue line is the control. Generations lie along the bottom axis, counts are on the verical axis. The line trends upwards. I think that is because the flies had been maintained for years simply by shaking an old vial with flies into a fresh vial. Thus, I suspect, they all suffered from outbreeding depression. During the study, each generation four males and four females were selected to restart each population each generation. This, apparently, released them from the outbreeding depression and raised fertility even five generations later. The red line is the experimental line. To my eye it is lower.
- It would be reasonable to ask whether we are lowering fertility by given folic acid in the doses we use. I do not know. Certainly with my crude methods I am not in a position seriously to question FDA recommendations. However, I hesitantly call for somebody to do the same study in fruit flies and in mice and do anything else possible to be sure.
- One reason to be skeptical of an effect in humans is that I would expect it to be visible in the UN numbers presented elsewhere, but this is not an excuse for failing to pursue this obviously important issue.
Computer program
- One of the occasions for mirth at Harvard Med was when a lecturer would show us a graph that looked like a random scatter of points and had a line running through it that he said summarized the points. Theory tends to be cleaner than reality. In this field, however, reality tends to be cleaner than theory, at least theory as embodied in a computer program I built. I think the noise could be improved a lot if somebody did the same thing but with a lot more random-access memory than I have ever had. It appears that nature has better equipment than I.
- Here is a sketch of the Sibly curve that relates kinship and fertility throughout the animal kingdom:
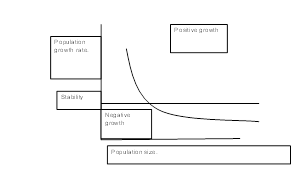 Fertility is on the vertical axis and population size – the inverse of kinship – along the bottom. Since this is a sketch rather than real data or the prediction of a theory – which would be a computer result – it is unrealistically clean, but that helps make it clear.
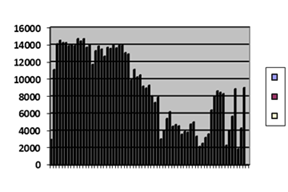
- Here are serial counts of wild mice in Australia, with a number of counting stations:
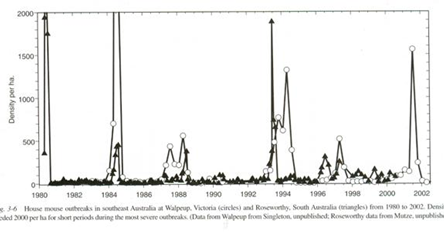
Most of the populations are low and stable most of the time. I could not duplicate that because my program, having a number of partly constrained random variables, was too noisy. Populations that were that small died of stochastic fall below 2.
- After playing around with parameters for a while, I could get the program to produce something like damped oscillation. Damped oscillation was the time course of caged fruit flies left to their own devices:
- Here is the computer simulation:
 You may quibble, but it looks to me like the graphs are similar. Then, keeping the parameters just the same, I increased the popultion size a bit.
- Here is the time course of a population of native farmers in Long House Valley.
 You can see a couple of examples of the notch pattern in the Australian mouse data above.
- Here is the computer simulation:
 I did not shop around looking for a best match. This was the first run. The population died out just as did the real population.
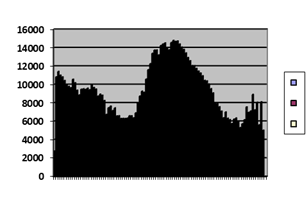
- Here is the time course of weevils in a Canadian forest; actually it is a computer model of experience. The gray is the amount of available food; the patterns are evidence of the insects. At first the insect population is limited by food, but then it dies out according to the rule: up, down, level off, die.
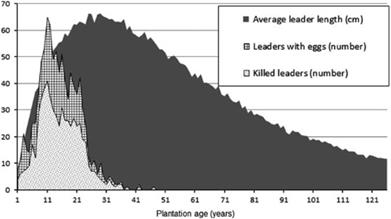
Natural Resources Canada Insects affecting regenerating conifers in Canada: natural history and management René I. Alfaro,1 Alvaro Fuentealba Can. Entomol. Vol. 00, 2015
- The same rule governs the time course of extinction of a colony of caged mice described by Calhoun.:
- And here is the computer simulation with a bigger maximum population, that what produced the damped oscillation. This is the first try and it uses the same parameters:
11. What is new is that A COMPUTER PROGRAM CAN MODEL THE TIME COURSES OF POPULATIONS UNDER THE INFLUENCE OF THE SIBLY CURVE AND THUS SUGGEST THE ACTUAL UNDERLYING EPIGENETIC MECHANISM.
Home page.